
Highlights as of April 2022:
- More than 2 years since the start of the pandemic, employment in the Innovation Corridor[1] is well above levels seen in February 2020 but still remains 2.4% (or approximately 114,000 jobs) below the pre-pandemic growth trajectory. (Figure 1) This employment gap is comparable to that seen after the Great Recession in 2008/2009. (Figure 2)
- After reaching a peak of 14.0%, the unemployment rate across the region has declined to 6.1% - 0.6 percentage points higher than the rate in February 2020. The employment rate[2] – an alternative indicator of the health of the labour market – now exceeds the pre-pandemic rate, signaling a healthy recovery in the region.
- The unemployment rate remains high due to a significant rise in the number of people looking for work in the Toronto CMA, where there were close to 168,000 more people in the labour force in April 2022 relative to February 2020. Across the Innovation Corridor, the participation rate[3] is 0.6 percentage points higher than prior to the pandemic.
- A handful of sectors continue to feel the pressures of the pandemic, including accommodation and food services; business, building and other support services (includes administrative and support services, waste management and remediation, and firms that manage other companies and/or hold their assets); other services; and transportation and warehousing. Together they account for 94 thousand fewer jobs relative to February 2020.
- Conversely, the financial services; information, culture and recreation; professional services; and wholesale and retail trade sectors have driven recovery – with more than 160 thousand net new jobs in these sectors as of April 2022 compared to pre-pandemic times.
[1] The Innovation Corridor comprises the five Census Metropolitan Areas (CMAs) of Oshawa, Toronto, Hamilton, Guelph and Kitchener-Cambridge-Waterloo.
[2] The employment rate is defined as the percentage of the population 15 years of age or older that are employed.
[3] The participation rate is defined as the percentage of the population 15 years of age or older that are in the labour force (either employed or actively looking for work).
Exhibits and Charts
Figure 1: Employment and Unemployment Rate (%), Innovation Corridor
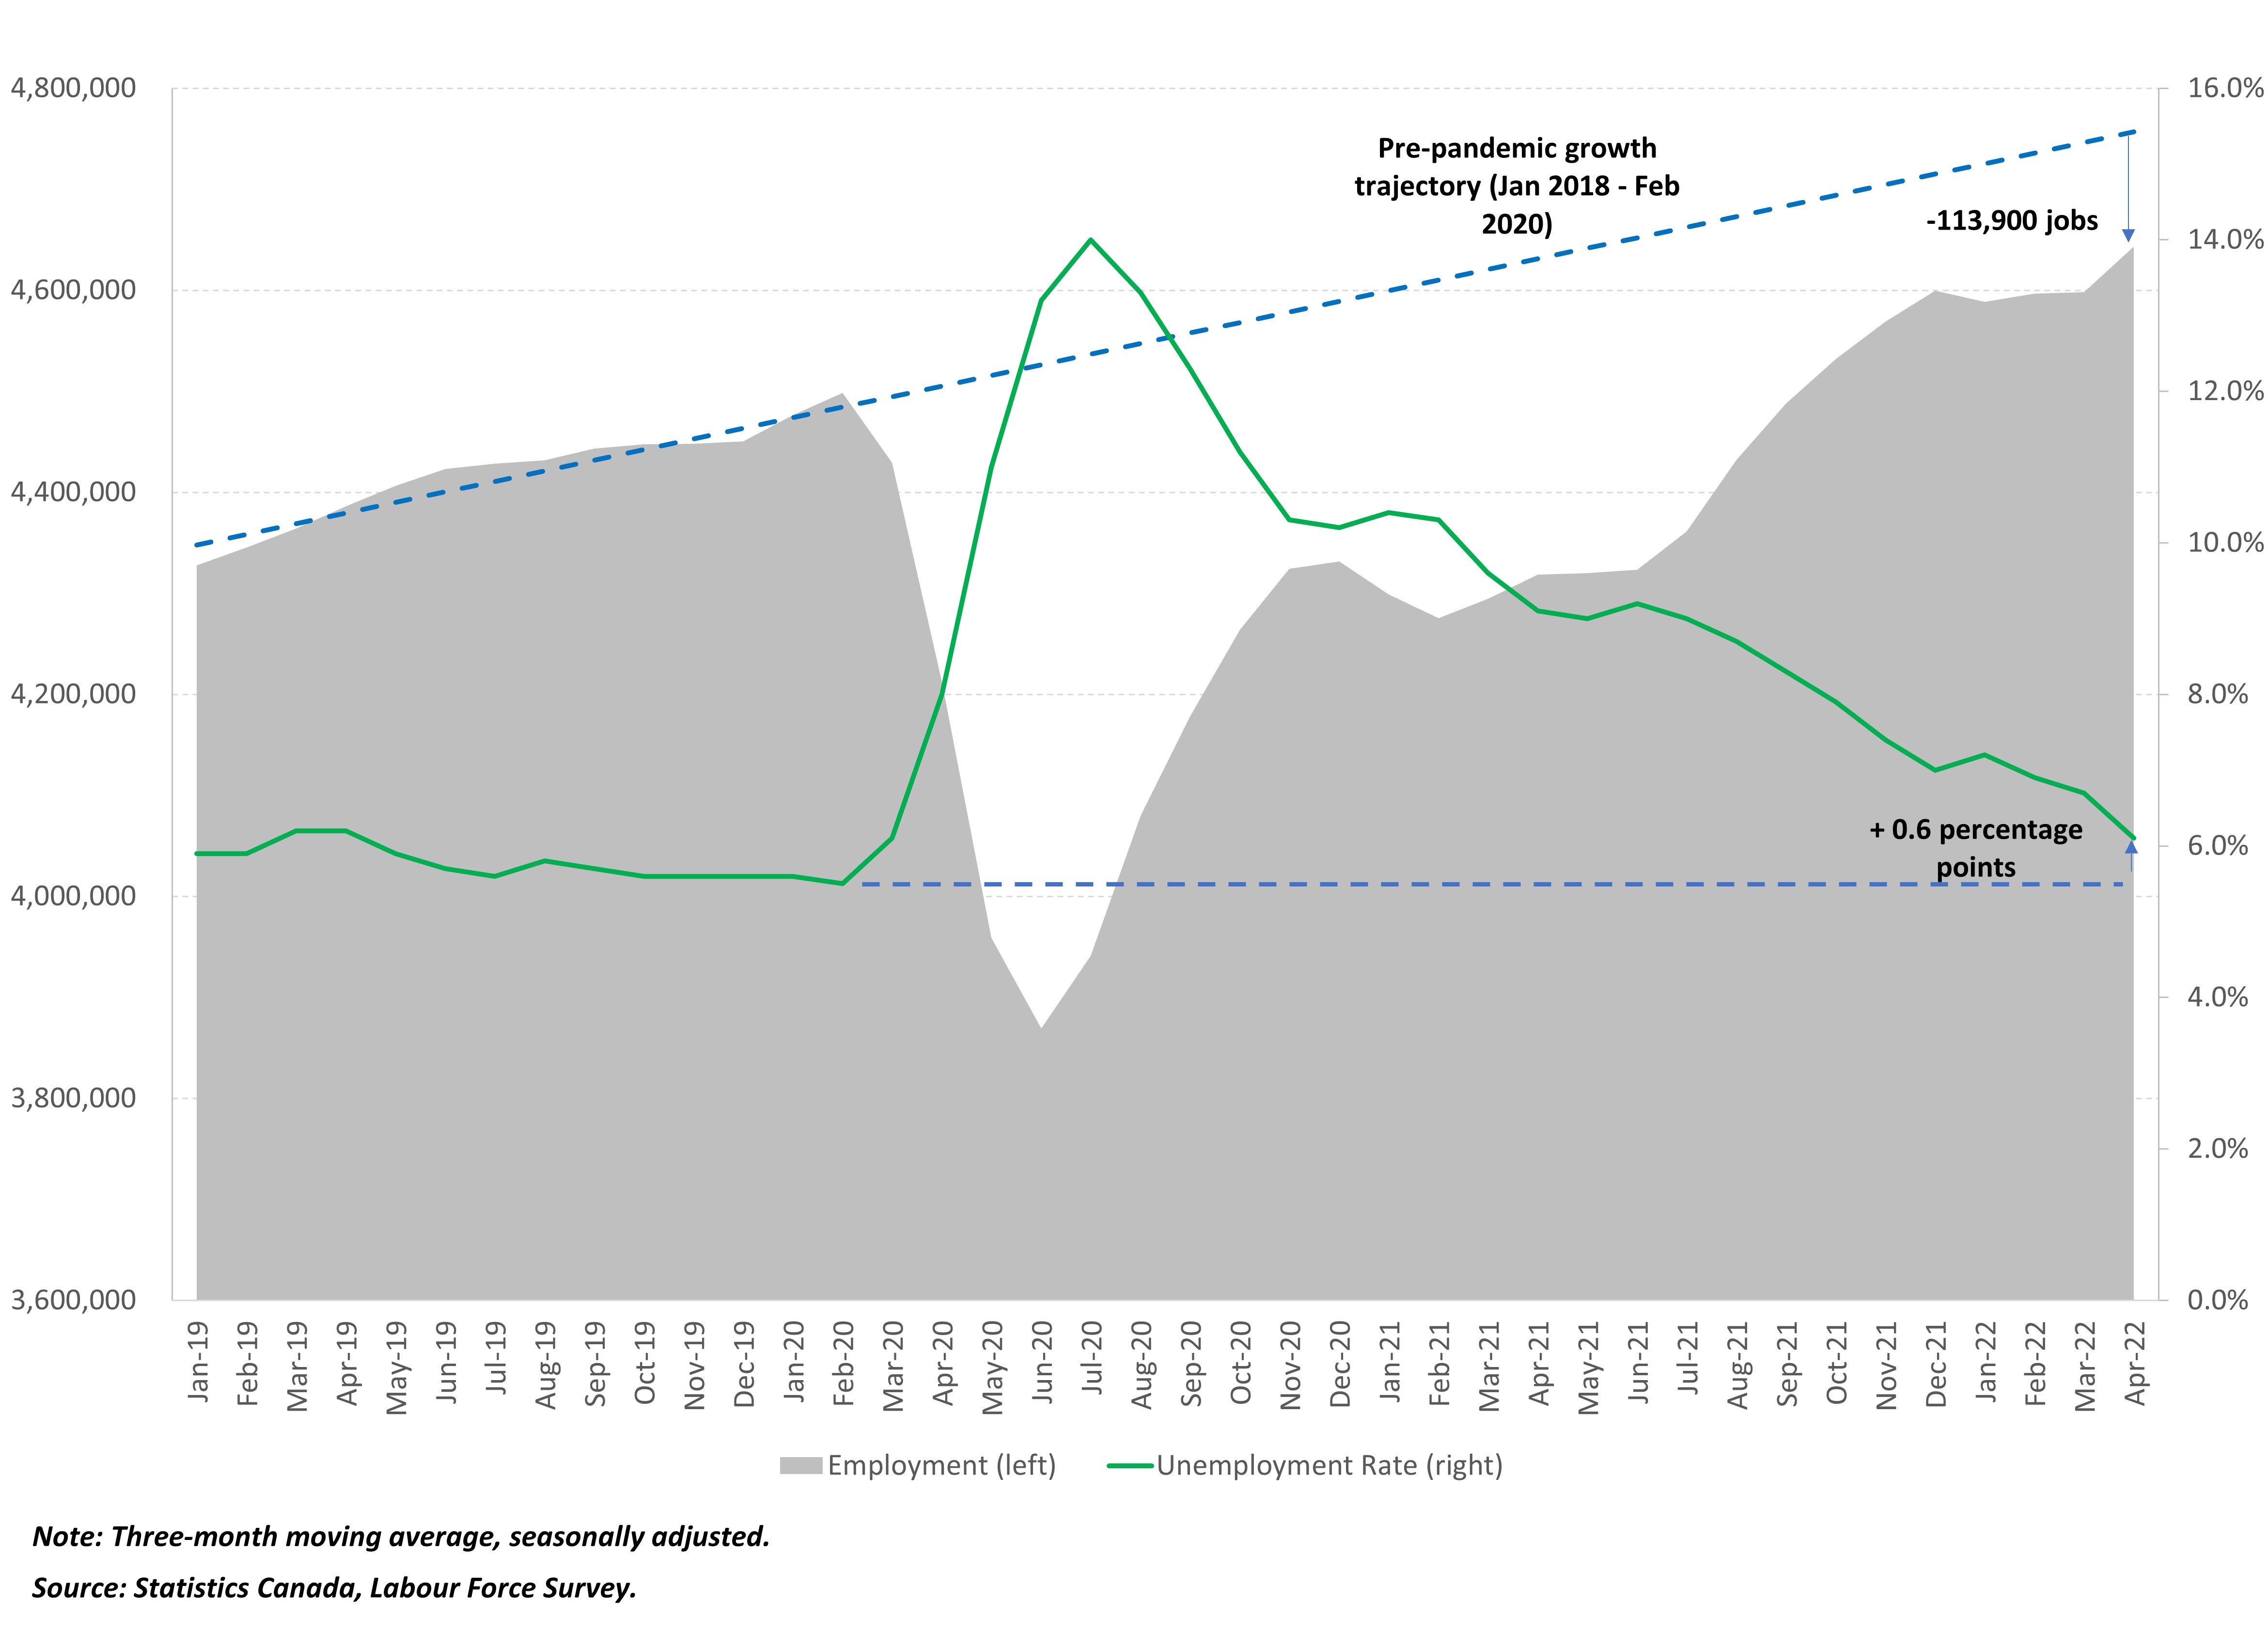
Employment is 3.2% higher than in February 2020 but remains 2.4% below the pre-pandemic trajectory. The unemployment rate across the region has declined to 6.1% - 0.6 percentage points higher than the rate in February 2020.
Figure 2: Employment Gap (% Difference from Pre-Recession Peak), Innovation Corridor
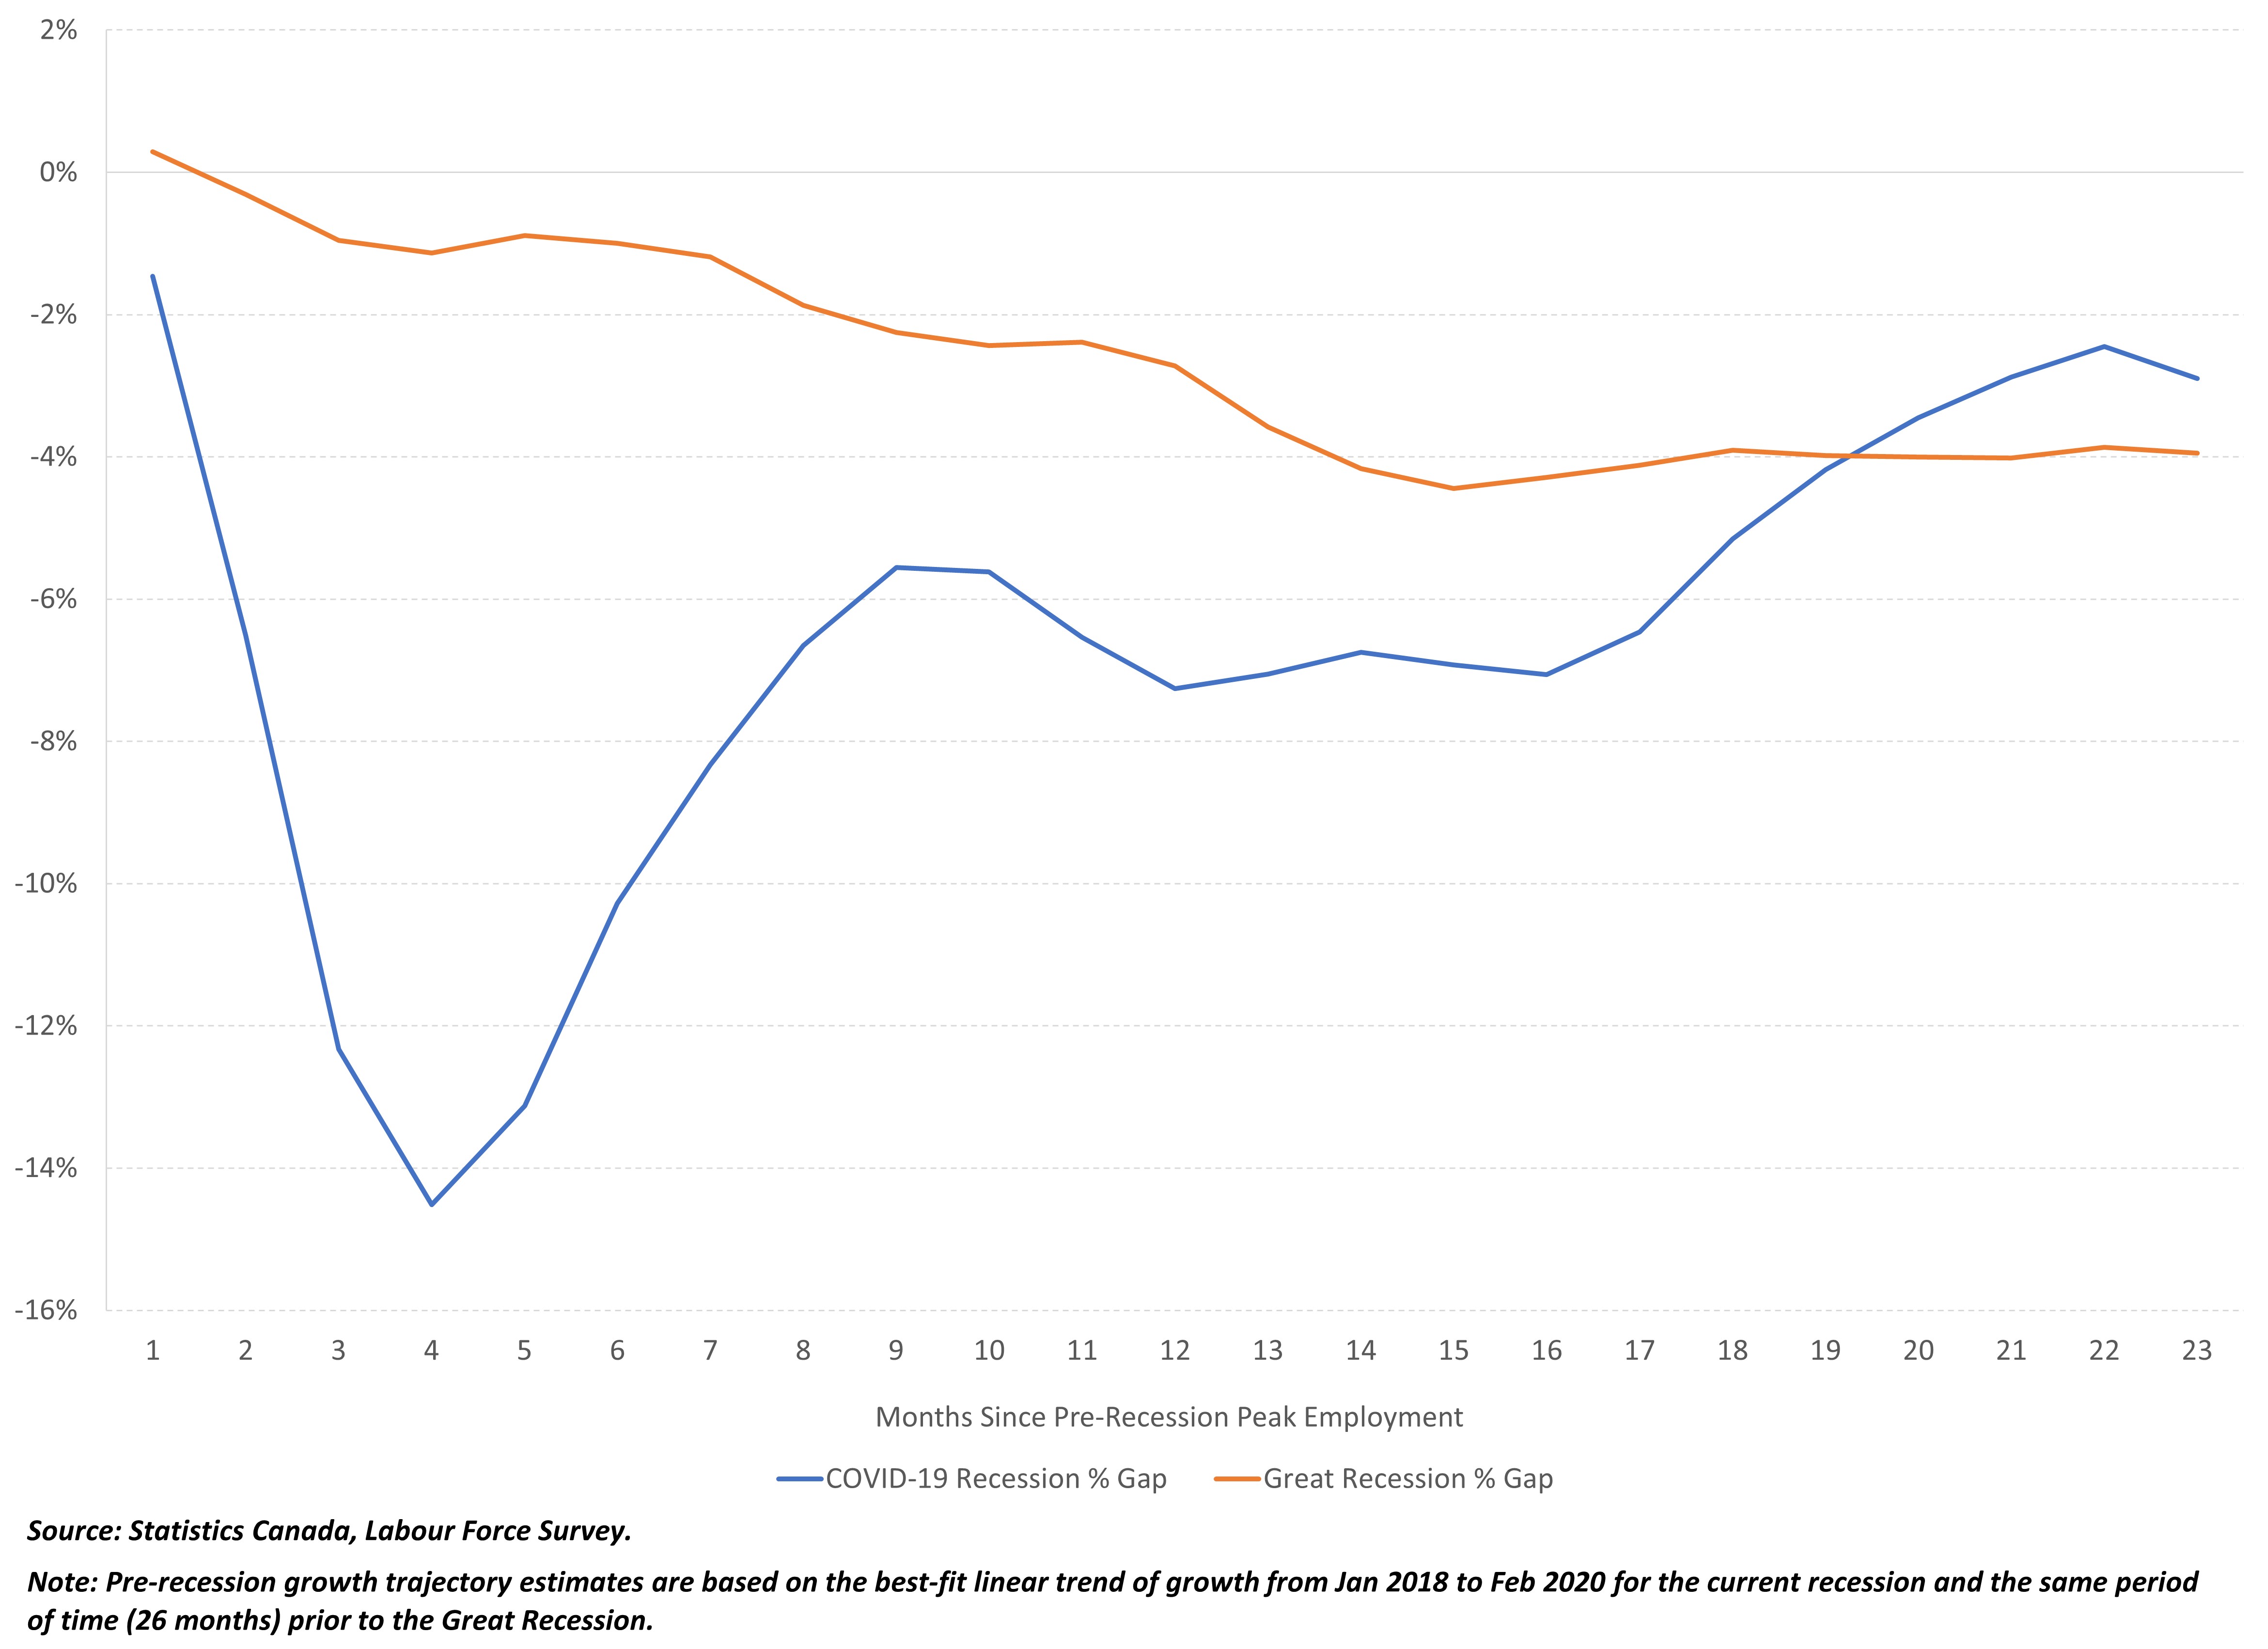
The employment gap between current levels and the pre-pandemic trajectory is comparable to that seen after the Great Recession in 2008/2009
Employment across the Innovation Corridor is 145,000 (or 3.2%) higher than in February 2020.
After reaching a peak of 14.0%, the unemployment rate across the region has declined to 6.1% - 0.6 percentage points higher than the rate in February 2020.
The employment rate across the region is 0.2 percentage points above the pre-pandemic rate, while the participation rate is 0.6 percentage points higher.
The financial services; information, culture and recreation; professional services; and wholesale and retail trade sectors have driven recovery – with more than 160 thousand net new jobs in these sectors as of April 2022.