

Highlights as of April 2022:
- The spread of COVID-19 and the associated public health restrictions led to noticeable changes in consumer spending patterns due to changing mobility patterns.
- In-person spending declined by at least 50% in all employment areas or Business Districts across the Innovation Corridor during the initial lockdown. Each consequent wave of the pandemic led to periods of declines and recovery in in-person spending. As of April 2022, in-person spending is at or near its highest level since the start of the pandemic across all Business Districts and above 2019 levels for all Business Districts except the Metropolitan Centre (MC).
- Businesses in the MC saw the most severe reduction in in-person sales, falling close to 90% below 2019 levels during the start of the pandemic. Since then, however, in-person sales have rebounded as of April 2022, spending remains 20% below 2019 levels and continues to trend upwards.
- E-commerce sales boomed during the pandemic, growing more than 50% relative to 2019 levels throughout periods in 2021 for businesses set up in the Goods Production and Distribution District (GPDD) and the Services and Mixed-Use District (SMUD). Growth in e-commerce sales has since slowed. Retail e-commerce sales in Canada reached as high as 11% of total retail sales in April 2020, but has averaged 6.4% between September 2021 and February 2022. (Figure 1) While notably larger than the pre-pandemic trend (average of 3.3% between January 2018 and January 2020), it is lower than the peaks seen through the pandemic.
- In most Business Districts, except the SMUD, travel and entertainment (T&E) was by far the worst performing in-person spending category through most of the pandemic. Since the start of 2022, the gap between T&E and services related spending has been reduced significantly.
- With the exception of the MC, retail has been the best performing in-person spending category and has exceeded 2019 levels through much of the pandemic.
Exhibits and Charts
Figure 1: E-Commerce Penetration (% of Total Retail Sales), Canada
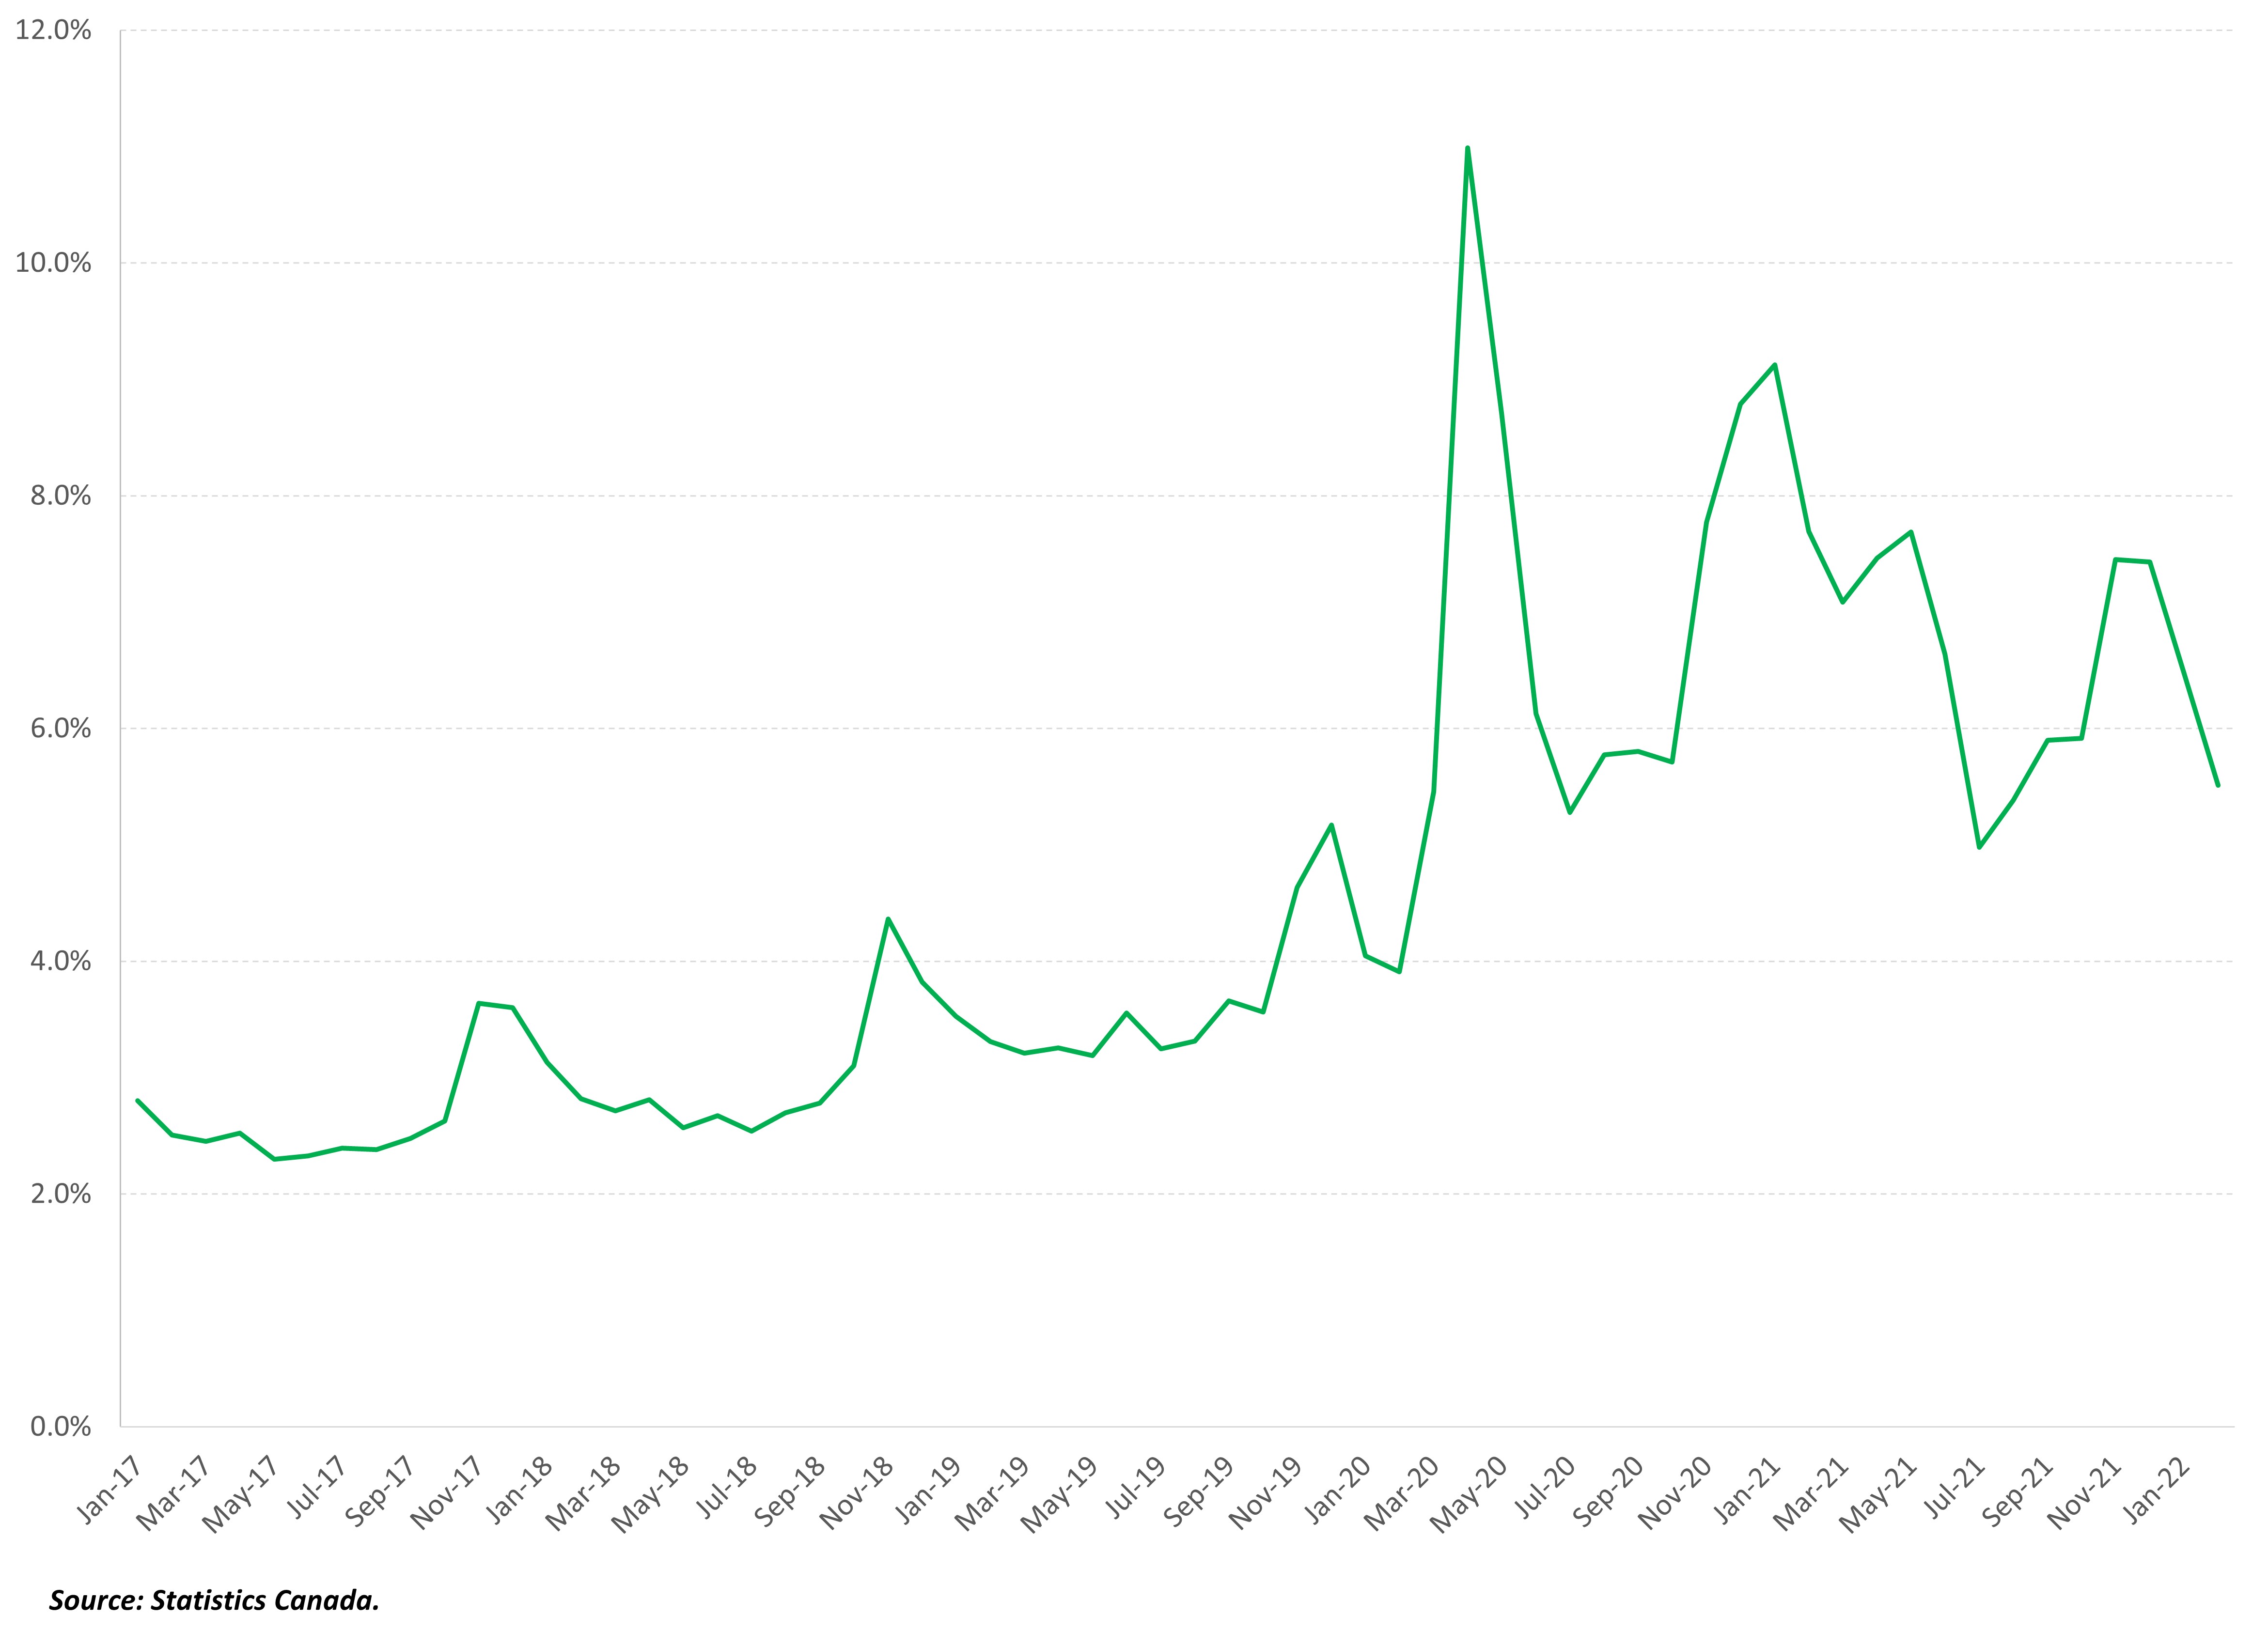
Retail e-commerce sales in Canada reached as high as 11% of total retail sales in April 2020, but has averaged 6.4% between September 2021 and February 2022.
In-person spending declined by at least 50% in all Business Districts during the initial lockdown. As of April 2022, in-person spending is above 2019 levels for all Business Districts except the Metropolitan Centre.
E-commerce sales boomed during the pandemic, growing more than 50% relative to 2019 levels throughout periods in 2021 for businesses set up in the Goods Production and Distribution District and the Services and Mixed-Use District. Growth in e-commerce sales has since slowed
In-person consumer spending in the Metropolitan Centre dropped below pre-pandemic levels across all spending categories. The pandemic had the strongest impact on spending related to travel & entertainment.
In-person consumer spending in the Goods Production and Distribution District dropped below pre-pandemic levels for spending related to services and travel & entertainment.
In-person consumer spending in the Services and Mixed District dropped below pre-pandemic levels for spending related to services and travel & entertainment.
The negative impact of the pandemic in the Regional Centres was especially pronounced for in-person consumer spending related to travel & entertainment.